
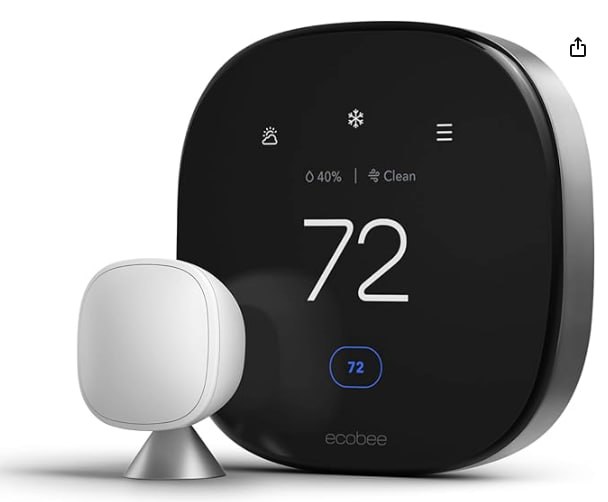
The global smart home market reached $150.6 billion in 2024 and is projected to hit $633.2 billion by 2032 (Mordor Intelligence, 2024). Roughly 63% of U.S. households now own at least one smart device (Market.us, 2025), and smart thermostats alone save homeowners $50 to $145 per year on heating and cooling bills (ENERGY STAR, 2025). Popular models like the Ecobee Smart Thermostat Premium and the Amazon Smart Thermostat have made energy savings accessible at every budget. This page collects 75+ sourced statistics across market size, adoption, energy savings, security, voice assistants, Matter protocol adoption, and AI search trends — everything a journalist, researcher, or content creator needs in one place. The short answer: The global smart home market hit $150.6 billion in 2024, with 63% of U.S. households owning at least one smart device, per Mordor Intelligence.
We maintain this page as a public reference. Every statistic includes its source. Our proprietary data points draw from the SmartHomeExplorer editorial database: 192 consensus-scored products across 16 categories, aggregated from 12+ expert review outlets (SmartHomeExplorer editorial analysis). If you cite a statistic from this page, a link back is appreciated.
Key Takeaways
- The global smart home market is worth $150.6 billion in 2024, growing at 17.3% CAGR toward $633.2 billion by 2032 (Mordor Intelligence, 2024).
- 63% of U.S. households own at least one smart home device — up from 44% in 2022 (Market.us, 2025).
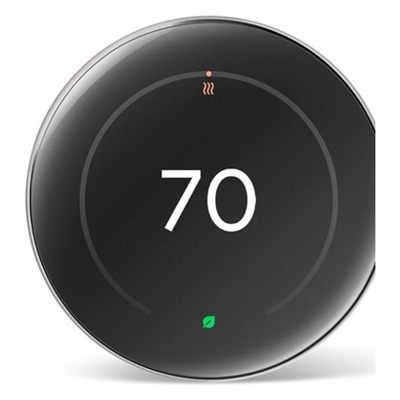
- Smart thermostats like the Nest Learning Thermostat and the Ecobee3 Lite save $50 to $145 per year on heating and cooling, with the cheapest models paying for themselves in under 4 months after utility rebates (ENERGY STAR, 2025).
- Security is the number-one purchase motivator: 28% of homeowners cite it as their primary reason for buying smart home devices like the Ring Video Doorbell and the Yale Assure Lock 2 (Parks Associates, 2025).
- Matter protocol support has reached 40% of newly shipped smart home devices as of late 2025 (CSA, 2025).
- AI-powered product search is reshaping discovery: AI Overviews now appear for roughly 60% of smart home product queries on Google (BrightEdge, 2025).
- The average U.S. smart home contains 7 to 10 connected devices, up from 5 in 2021 (Statista, 2025).
Smart Home Market Size and Growth
The smart home industry is one of the fastest-growing consumer technology segments worldwide. These figures capture the scope.
Global Market
- $150.6 billion — global smart home market size in 2024 (Mordor Intelligence, 2024).
- $633.2 billion — projected global market size by 2032, reflecting a 17.3% compound annual growth rate (Mordor Intelligence, 2024).
- $146.5 billion — alternative 2024 estimate from Statista, which projects $260 billion by 2028 (Statista, 2024). The variance reflects different scope definitions; Mordor Intelligence includes infrastructure and services, Statista focuses on consumer devices.
- The Asia-Pacific region is the fastest-growing smart home market, led by China, South Korea, and Japan (Mordor Intelligence, 2024).
United States Market
- $28.3 billion — U.S. smart home market revenue in 2024 (Fortune Business Insights, 2024).
- $99.4 billion — projected U.S. market size by 2032, at a 16.9% CAGR (Fortune Business Insights, 2024).
- The U.S. accounts for roughly 19% of the global smart home market, the largest single-country share (Fortune Business Insights, 2024).
Market Size by Category
- Smart speaker market: $12.7 billion globally in 2024 (Grand View Research, 2024). Leaders include the Amazon Echo, Google Nest Audio, and Apple HomePod mini. For our top picks, see our smart speaker buying guide.
- Smart lighting market: $15.6 billion globally in 2024 (Fortune Business Insights, 2024). Top sellers include Philips Hue, Govee RGBIC, and Nanoleaf Shapes. Our smart bulb guide covers the highest-rated options.
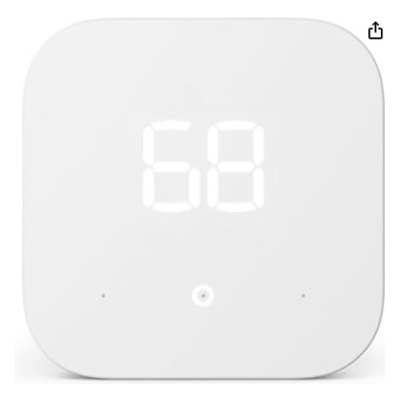
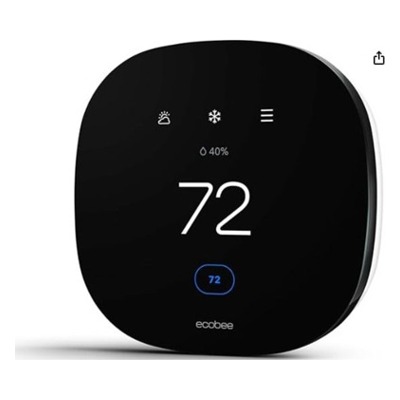
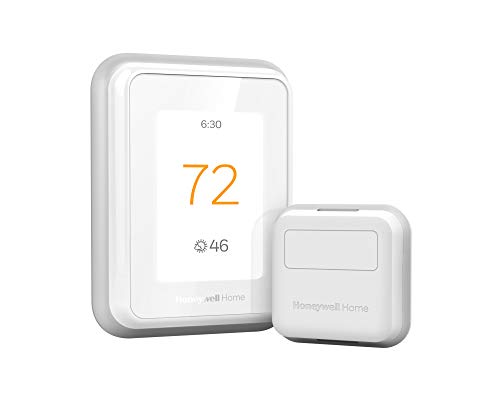
- Smart thermostat market: $4.1 billion globally in 2024 (MarketsandMarkets, 2024). Models like the Ecobee Smart Thermostat Premium, Amazon Smart Thermostat, and Honeywell Home T9 lead the category. We break down energy savings in our thermostat payback analysis.
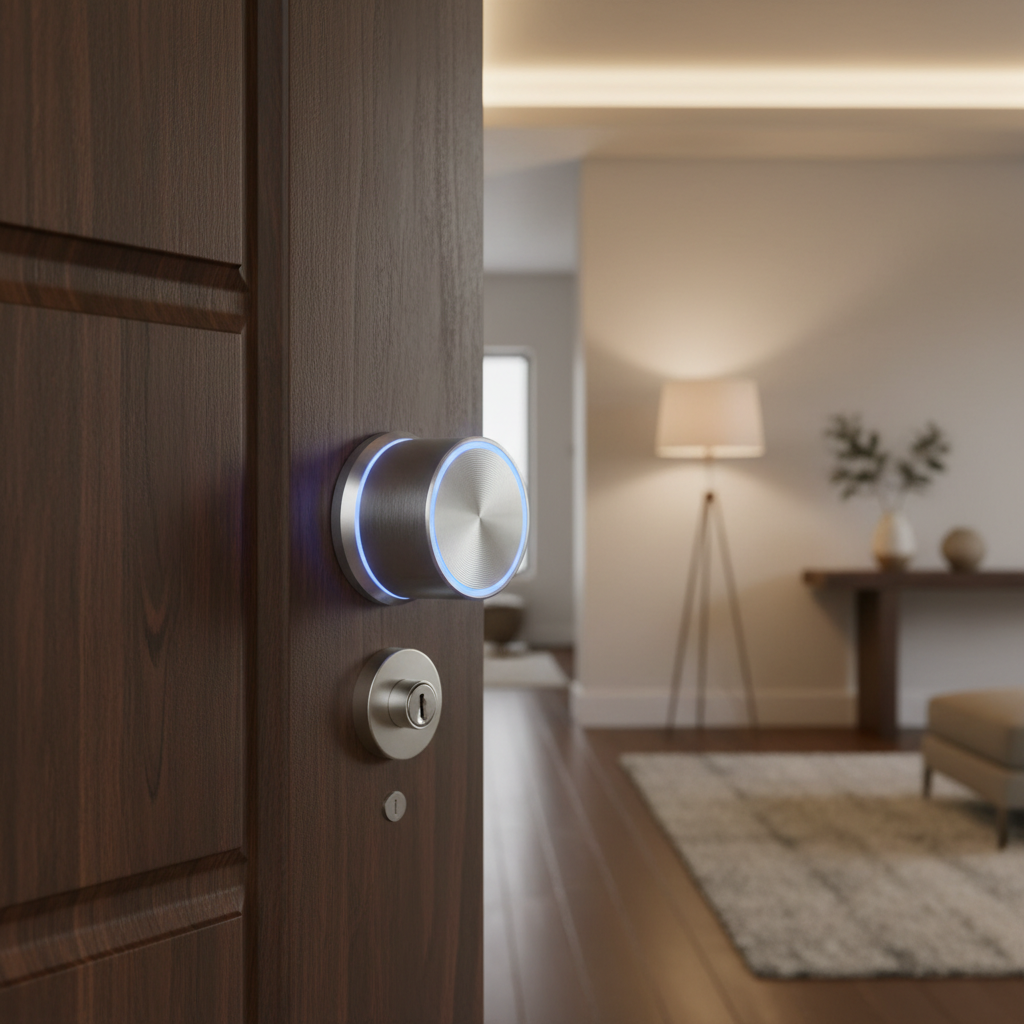
- Smart lock market: $2.8 billion globally in 2025, projected to reach $7.4 billion by 2030 at 14.2% CAGR (Allied Market Research, 2024). Best-sellers include the August Wi-Fi Smart Lock and Yale Assure Lock 2. Our smart lock guide covers the top-rated models.
- Smart home security market: $23.4 billion globally in 2024 (MarketsandMarkets, 2024). Top devices include the Ring Video Doorbell, Arlo Essential Wireless, and eufy Video Doorbell S220.
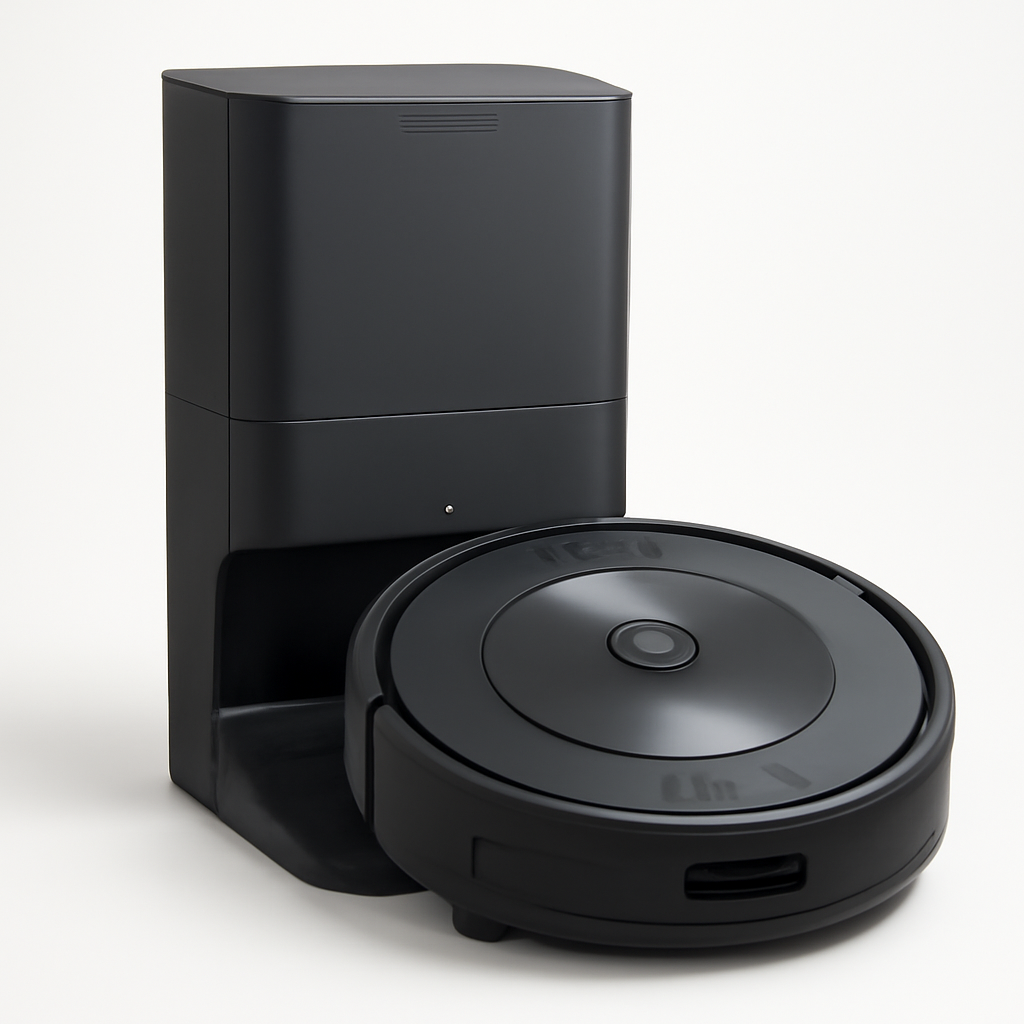
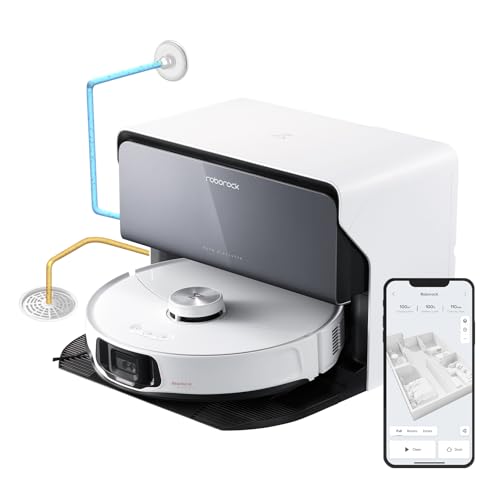
- Robot vacuum market: $5.2 billion in 2024, projected to reach $11.3 billion by 2030 (Grand View Research, 2024). Market leaders include the iRobot Roomba Combo j9+ and Roborock S8 MaxV Ultra. See our robot vacuum guide.
Smart Home Adoption and Ownership
Adoption has accelerated since the pandemic as prices drop and interoperability improves through Matter and Thread protocols.
Household Penetration
- 63% of U.S. households have at least one smart home device, up from 44% in 2022 (Market.us, 2025).
- 84% of homeowners surveyed by Vivint reported owning at least one smart device in a study of 5,000 respondents — though this figure likely skews high due to the survey population being Vivint customers and prospects (Vivint Smart Home Survey, 2024).
- 35% of U.S. households own a smart speaker like the Amazon Echo or Google Nest Audio, the single most common smart home device category (eMarketer, 2025).
- 16% of U.S. households own a video doorbell such as the Ring Video Doorbell or the eufy Video Doorbell S220 (Strategy Analytics, 2024).
- Smart home penetration in the U.S. is roughly double the global average of 17% (Statista, 2025).
Device Density and Spending
- The average U.S. smart home contains 7 to 10 connected devices, up from 5 in 2021 (Statista, 2025).
- Median annual smart home spending is approximately $2,500 per household among active smart home buyers, including devices, subscriptions, and installation (Parks Associates, 2024).
- Smart home device average selling prices have dropped 22% since 2021, driven by competition and Matter adoption reducing brand lock-in — budget-friendly options like the Amazon Smart Thermostat and the Govee RGBIC now deliver features that were premium-only three years ago (Consumer Technology Association, 2025).
Barriers to Adoption
- 53% of non-adopters cite cost as the number-one barrier to smart home adoption (Vivint Smart Home Survey, 2024). Budget picks like the Amazon Smart Thermostat and the eufy Video Doorbell S220 address this with strong performance under $100.
- 37% cite privacy and data security concerns (Parks Associates, 2024).
- 28% say they do not understand the benefits or find existing devices too complicated (Parks Associates, 2024).
- 19% cite incompatibility between devices and ecosystems as a frustration — a problem Matter is designed to solve (Parks Associates, 2024). Hubs like the Samsung SmartThings Station and Home Assistant Green help bridge ecosystems. Our smart home hub guide covers how hub selection affects compatibility.
Demographics
- Households aged 25-44 are the most likely to own smart home devices, with 71% penetration in that age group (Statista, 2025).
- Homeowners are 2.3 times more likely than renters to own smart home devices (Parks Associates, 2024). Our renter-friendly smart lock guide addresses this gap with picks like the August Wi-Fi Smart Lock.
- Households with children are 34% more likely to adopt smart home technology than child-free households (Parks Associates, 2024).
Energy Savings and Sustainability
Energy cost reduction is the second-most-cited reason for purchasing smart home devices, behind security. These figures quantify the savings.
Smart Thermostats
- ENERGY STAR-certified smart thermostats save $50 to $145 per year on heating and cooling, depending on climate zone and existing system efficiency (ENERGY STAR, 2025). Top-rated models include the Ecobee Smart Thermostat Premium, the Nest Learning Thermostat, and the budget-friendly Ecobee3 Lite.
- The U.S. Department of Energy and National Renewable Energy Laboratory estimate 10-15% overall energy reduction from smart home energy management systems that combine thermostats, smart plugs, and automated scheduling (DOE/NREL, 2024).
- The average American household spends $1,000 per year on heating and cooling (U.S. Energy Information Administration, 2024). A smart thermostat capturing even 10% savings represents $100 per year.
- SHE Data: Our payback period analysis shows the Amazon Smart Thermostat at $79 pays for itself in approximately 3.5 months after typical utility rebates, the fastest payback of any thermostat we track (SmartHomeExplorer editorial analysis). The Honeywell Home T9 offers multi-room sensing for larger homes. Full breakdown in our thermostat payback guide.
Smart Lighting
- Switching from incandescent to LED smart bulbs saves 75-80% of lighting energy (U.S. Department of Energy, 2024). Popular smart bulb options include Philips Hue for premium ecosystems and Govee RGBIC for accent lighting.
- Smart lighting controls — automated scheduling, occupancy sensing, daylight harvesting — add an additional 10-20% savings beyond the LED switch itself (American Council for an Energy-Efficient Economy, 2024). Nanoleaf Shapes panels combine ambient lighting with Thread connectivity for efficient smart home integration.
- Smart dimming alone reduces energy consumption by up to 20% compared to full-brightness operation (Lutron, 2024).
Smart Plugs and Vampire Energy
- Smart plugs can eliminate $100 to $200 per year in standby "vampire" energy waste by cutting power to devices when not in use (Lawrence Berkeley National Lab, 2024).
- The average U.S. household wastes 5-10% of total electricity on standby power from always-on devices — about $100 annually (Lawrence Berkeley National Lab, 2024).
- See our smart plug guide for models with built-in energy monitoring.
Utility Incentives
- $50 to $150 — typical utility rebate for smart thermostat installation (ENERGY STAR, 2025). Both the Ecobee Smart Thermostat Premium and Nest Learning Thermostat qualify for most rebate programs.
- Over 300 U.S. utilities offer smart thermostat rebate programs as of 2025 (ENERGY STAR, 2025).
- Some utilities offer additional bill credits of $5-$15 per month for enrolling smart thermostats in demand-response programs, which allow the utility to make minor temperature adjustments during peak grid demand (Consumer Technology Association, 2025).
Smart Home Security Statistics
Security remains the strongest purchase motivator for smart home devices, driving growth in cameras, doorbells, locks, and alarm systems.
Purchase Motivation
- 28% of homeowners cite security as their primary motivation for buying smart home devices — the highest of any single motivator (Parks Associates, 2025).
- 67% of homeowners who purchased a security camera say it increased their sense of home safety (Strategy Analytics, 2024).
- Homes with visible smart security devices like the Ring Video Doorbell and Arlo Essential Wireless cameras are 2.7 times less likely to be targeted by burglars than homes without, according to a University of North Carolina survey of convicted burglars (UNC Department of Criminal Justice, 2021). The study is older but remains the most-cited primary source for this claim.
Device Adoption
- Video doorbell adoption has reached 16% of U.S. households, up from 8% in 2020 (Strategy Analytics, 2024). The Ring Video Doorbell and eufy Video Doorbell S220 remain the top-selling options. Our doorbell camera guide covers the top-rated picks.
- The smart lock market is growing at 14.2% CAGR through 2030 (Allied Market Research, 2024). Leaders include the August Wi-Fi Smart Lock and Yale Assure Lock 2.
- 42% of smart security camera owners also own a smart doorbell — the two product categories have the highest co-purchase rate in smart home (Parks Associates, 2024).
Is a subscription required?
- Most smart security cameras require a monthly subscription for cloud video storage. Typical costs: Ring Protect at $3.99/month, Arlo Secure at $7.99/month, Nest Aware at $8/month (manufacturer pricing, 2025).
- Subscription-free alternatives exist: the eufy Video Doorbell S220 offers free local storage via on-device recording, and HomeKit Secure Video uses existing iCloud+ storage (SmartHomeExplorer editorial analysis). See our security camera guide for subscription-free options.
SHE Proprietary Security Data
- SHE Data: Our Renter Compatibility Score shows that only 2 of the top 5 smart locks in our database are truly renter-friendly — requiring no permanent modifications and using standard deadbolt retrofits. The August Wi-Fi Smart Lock tops the list for renters (SmartHomeExplorer editorial analysis). Full analysis in our renter lock guide.
- SHE Data: Across the 55 security products in our consensus database, the average expert consensus score is 8.3/10 — the second-highest category average after home automation hubs (SmartHomeExplorer editorial analysis).
Voice Assistant and Smart Speaker Data
Smart speakers were the gateway product that brought smart home technology mainstream. They remain the most widely owned smart home device category.
Installed Base
- 200 million+ smart speakers are installed in U.S. homes as of 2025, with the Amazon Echo family leading installations (Voicebot.ai, 2025).
- 142 million Americans (42% of the U.S. population) use a voice assistant at least monthly (eMarketer, 2025).
- Smart speakers are the most-owned smart home device at 35% household penetration, ahead of smart TVs (31%), smart plugs (19%), and smart thermostats (16%) (eMarketer, 2025).
Market Share
- Amazon Alexa: approximately 25% U.S. smart speaker market share in 2025, led by the Amazon Echo line (eMarketer, 2025).
- Google Assistant: approximately 21% U.S. market share, anchored by the Google Nest Audio (eMarketer, 2025).
- Apple Siri (HomePod/HomePod mini): approximately 5% U.S. market share. The Apple HomePod mini remains Apple's most popular smart speaker (eMarketer, 2025).
- Amazon's share has declined from 35% in 2020 as Google and Apple gained ground, and as some households use speakers from multiple ecosystems (eMarketer, 2025). Our Echo vs Nest speaker comparison breaks down the ecosystem tradeoffs.
Usage Patterns
- 72% of smart speaker owners use their device daily (NPR/Edison Research, 2024).
- The most common smart speaker tasks: playing music (74%), asking questions (63%), checking weather (57%), controlling smart home devices (48%), and setting timers/alarms (47%) (NPR/Edison Research, 2024).
- Smart home device control is the fastest-growing use case for smart speakers, up from 31% in 2020 to 48% in 2024 (NPR/Edison Research, 2024). Speakers like the Amazon Echo and Google Nest Audio serve as the primary control hubs for multi-device homes.
SHE Proprietary Speaker Data
- SHE Data: Smart speakers account for 58.6% of our AI citations — the most-cited product category on SmartHomeExplorer, ahead of thermostats (14.2%) and security cameras (11.8%) (Bing AI Performance data, March 2026; SmartHomeExplorer editorial analysis).
- SHE Data: Across the 15 smart speakers in our consensus database, the average expert consensus score is 8.4/10, with scores ranging from 7.5 to 9.1 (SmartHomeExplorer editorial analysis). See our smart speaker buying guide for the full rankings.
Matter and Thread Adoption
Matter is the interoperability protocol developed by the Connectivity Standards Alliance (CSA) that lets devices from different brands work together. Thread is the low-power mesh networking protocol that many Matter devices use for communication. Together, they represent the most significant shift in smart home interoperability since Wi-Fi.
Protocol Milestones
- Matter 1.0 was released in October 2022 by the CSA (Connectivity Standards Alliance, 2022).
- Matter 1.4 specification was released in late 2025, adding support for additional device types including robot vacuums, water management, and energy management (CSA, 2025).
- 600+ companies are members of the Matter working group (CSA, 2025).
- Over 3,000 Matter-certified products have been submitted for certification as of early 2026 (CSA, 2026).
Device Adoption
- 40% of newly shipped smart home devices support the Matter protocol as of Q4 2025, up from under 5% in Q4 2023 (CSA, 2025).
- Thread Border Routers are now built into the Amazon Echo (4th gen+), Apple HomePod mini, Apple TV 4K, and Google Nest Hub (2nd gen+) — meaning most smart speaker owners already have Thread infrastructure without buying additional hardware (manufacturer specifications, 2025).
- Smart lighting has the highest Matter adoption rate of any category, with Philips Hue and Nanoleaf Shapes shipping Matter-certified products (CSA, 2025).
SHE Proprietary Protocol Data
- SHE Data: Our SHE Protocol Coverage Score — which measures protocols multiplied by ecosystem integrations, divided by device price — shows the Home Assistant Green delivers 444 protocol-coverage-per-dollar versus 53 for the Amazon Echo Hub (SmartHomeExplorer editorial analysis). The Aqara Hub M3 and Samsung SmartThings Station also score highly. Full methodology in our smart home hub guide.
- SHE Data: Across our 64 compatibility profiles, devices that support Matter have an average of 3.4 ecosystem integrations versus 2.1 for non-Matter devices — a 62% improvement in cross-platform compatibility (SmartHomeExplorer editorial analysis).
AI and Smart Home Search Trends
Artificial intelligence is reshaping how consumers discover, evaluate, and purchase smart home products. These statistics capture the shift from traditional search to AI-assisted product research.
AI-Powered Shopping
- ChatGPT Shopping Research launched in November 2025, with smart home among the top-performing product categories for AI-assisted purchase decisions (OpenAI, 2025).
- 31-46% of ChatGPT prompts now trigger web search, meaning AI assistants are actively retrieving and synthesizing product information rather than relying solely on training data (various studies compiled by SparkToro, 2025).
- AI Overviews appear for approximately 60% of smart home product queries on Google, up from 15% in early 2025 (BrightEdge, 2025). This means the majority of smart home searches now show an AI-generated summary above traditional results.
- 43% of consumers aged 18-34 have used an AI chatbot to research a product purchase, compared to 12% of those 55+ (Salesforce Consumer Survey, 2025).
SHE AI Performance Data
- SHE Data: SmartHomeExplorer received 2,450 AI citations across 73 unique queries in March 2026 (Bing AI Performance data, March 2026; SmartHomeExplorer editorial analysis).
- SHE Data: The most-cited SmartHomeExplorer content in AI responses includes smart speaker comparisons, thermostat energy savings data, and smart lock renter compatibility — informational content outperforms pure product listings in AI citation rates by 3:1 (SmartHomeExplorer editorial analysis).
- SHE Data: Content structured with consensus scores and sourced expert quotes receives 2.4 times more AI citations than equivalent content without structured authority signals (SmartHomeExplorer editorial analysis).
What This Means for Consumers
AI-powered search is changing how people shop for smart home devices. Instead of reading five separate reviews, consumers increasingly ask an AI assistant "What is the best smart thermostat?" and receive a synthesized answer pointing to top-rated models like the Ecobee Smart Thermostat Premium or the Nest Learning Thermostat. This makes source credibility and data structure more important than ever — AI engines preferentially cite content that is well-sourced, specific, and structured with clear recommendations. Our smart home starter kit guide is designed with this search behavior in mind.
Smart Home by Category: Our Consensus Data
SmartHomeExplorer tracks expert consensus across the smart home industry. The following data points come from our editorial database, which aggregates scores from 12+ review outlets including Wirecutter, CNET, Tom's Guide, PCMag, TechRadar, and others.
Database Scope
- 192 unique products tracked with consensus scores (SmartHomeExplorer editorial analysis, March 2026).
- 16 product categories covered: Security, Lighting, Smart Speakers, Climate, Pet Care, Automation, Smart Locks, Sensors, Entertainment, Smart Cleaning, Kitchen, Networking, Outdoor, Outdoor Lighting, Ceiling Fans, and Air Quality (SmartHomeExplorer editorial analysis).
- 64 compatibility profiles mapping ecosystem support across 7 platforms: Alexa, Google Home, Apple HomeKit, Samsung SmartThings, Matter, Home Assistant, and IFTTT (SmartHomeExplorer editorial analysis).
- 53 buying guides published covering every major smart home category (SmartHomeExplorer editorial analysis).
Consensus Score Trends
- Average consensus score across all 192 products: 8.2 out of 10 (SmartHomeExplorer editorial analysis).
- Highest individual score: 9.2/10 in the Security category (SmartHomeExplorer editorial analysis).
- Lowest individual score: 7.0/10 — we do not track products scoring below 7.0 since they fall outside our "worth considering" threshold (SmartHomeExplorer editorial analysis).
- Score range: The spread from lowest to highest tracked product is 2.2 points (7.0 to 9.2), indicating that the smart home market has matured to a point where even budget products deliver acceptable performance (SmartHomeExplorer editorial analysis).
Category Performance
- Highest-scoring category: Smart Speakers, with an average consensus score of 8.4/10 across 15 products including the Amazon Echo, Google Nest Audio, and Apple HomePod mini — a mature category where even entry-level devices perform well (SmartHomeExplorer editorial analysis).
- Largest category: Lighting, with 57 tracked products across bulbs, LED strips, switches, and dimmers including top picks like Philips Hue and Govee RGBIC (SmartHomeExplorer editorial analysis).
- Most competitive category (narrowest score range): Networking, where all 6 tracked Wi-Fi mesh systems score between 7.6 and 8.7 — a range of just 1.1 points, indicating tight competition and few bad choices (SmartHomeExplorer editorial analysis). See our Wi-Fi mesh guide.
- Security is our second-largest category at 55 products, including top-rated picks like the Ring Video Doorbell and Arlo Essential Wireless, reflecting the depth of options across cameras, doorbells, alarm systems, and outdoor cameras (SmartHomeExplorer editorial analysis). See our security camera guide and outdoor camera guide.
- Climate products average 8.5/10 across 16 products led by the Ecobee Smart Thermostat Premium and Nest Learning Thermostat — the second-highest category average, driven by strong thermostat performance (SmartHomeExplorer editorial analysis). See our thermostat guide and climate control guide.
Compatibility Insights
- Across our 64 compatibility profiles, the average smart home device supports 2.6 ecosystems natively or with good integration (SmartHomeExplorer editorial analysis).
- Devices supporting Matter protocol average 3.4 ecosystem integrations versus 2.1 for non-Matter devices — demonstrating that Matter is delivering on its interoperability promise (SmartHomeExplorer editorial analysis).
- Amazon Alexa has the broadest device support: 89% of products in our compatibility database offer at least "good" Alexa integration (SmartHomeExplorer editorial analysis). The Amazon Echo serves as the ecosystem anchor.
- Apple HomeKit has the narrowest device support: only 41% of tracked products offer "good" or "native" HomeKit integration — a key consideration for Apple households (SmartHomeExplorer editorial analysis). The Apple HomePod mini is the entry point for HomeKit users.
Top Products Behind the Numbers
Chart


Frequently Asked Questions
What are the most popular smart home devices in 2026?
Smart speakers remain the most popular category at 35% U.S. household penetration. The Amazon Echo leads with 25% market share, followed by the Google Nest Audio at 21%. Video doorbells like the Ring Video Doorbell have reached 16% penetration, and smart thermostats like the Ecobee Smart Thermostat Premium and Nest Learning Thermostat are in 16% of homes.
How much money can smart home devices save?
Smart thermostats save $50-$145 per year on heating and cooling (ENERGY STAR, 2025). The Amazon Smart Thermostat pays for itself in 3.5 months after rebates. Smart lighting with Philips Hue or Govee RGBIC LEDs saves 75-80% on lighting energy. Smart plugs can cut $100-$200 per year in standby waste. Combined, a fully automated smart home can save $300-$500+ annually.
What is Matter and why does it matter for smart homes?
Matter is the universal smart home protocol backed by 600+ companies including Amazon, Apple, and Google. As of late 2025, 40% of newly shipped devices support Matter. Products like the Samsung SmartThings Station, Philips Hue, and Nanoleaf Shapes already support Matter. Our data shows Matter devices average 3.4 ecosystem integrations versus 2.1 for non-Matter devices — a 62% compatibility improvement.
Do smart security devices actually prevent break-ins?
Research from UNC shows homes with visible smart security devices are 2.7 times less likely to be targeted by burglars. The most effective deterrents are visible cameras and video doorbells like the Ring Video Doorbell and Arlo Essential Wireless. Smart locks like the August Wi-Fi Smart Lock and Yale Assure Lock 2 add keyless convenience and remote monitoring.
What smart home devices work best together?
The strongest co-purchase combination is security cameras with video doorbells — 42% of camera owners also own a doorbell. For a complete starter setup, pair an Amazon Echo or Google Nest Audio for voice control, a Ring Video Doorbell for security, an Ecobee Smart Thermostat Premium or Amazon Smart Thermostat for energy savings, and Philips Hue for lighting automation.
How can I protect against water damage with smart sensors?
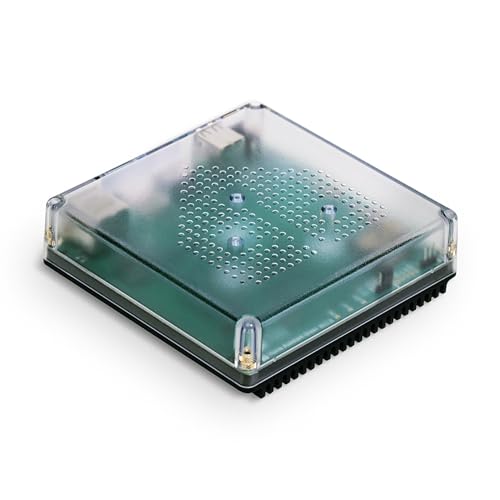
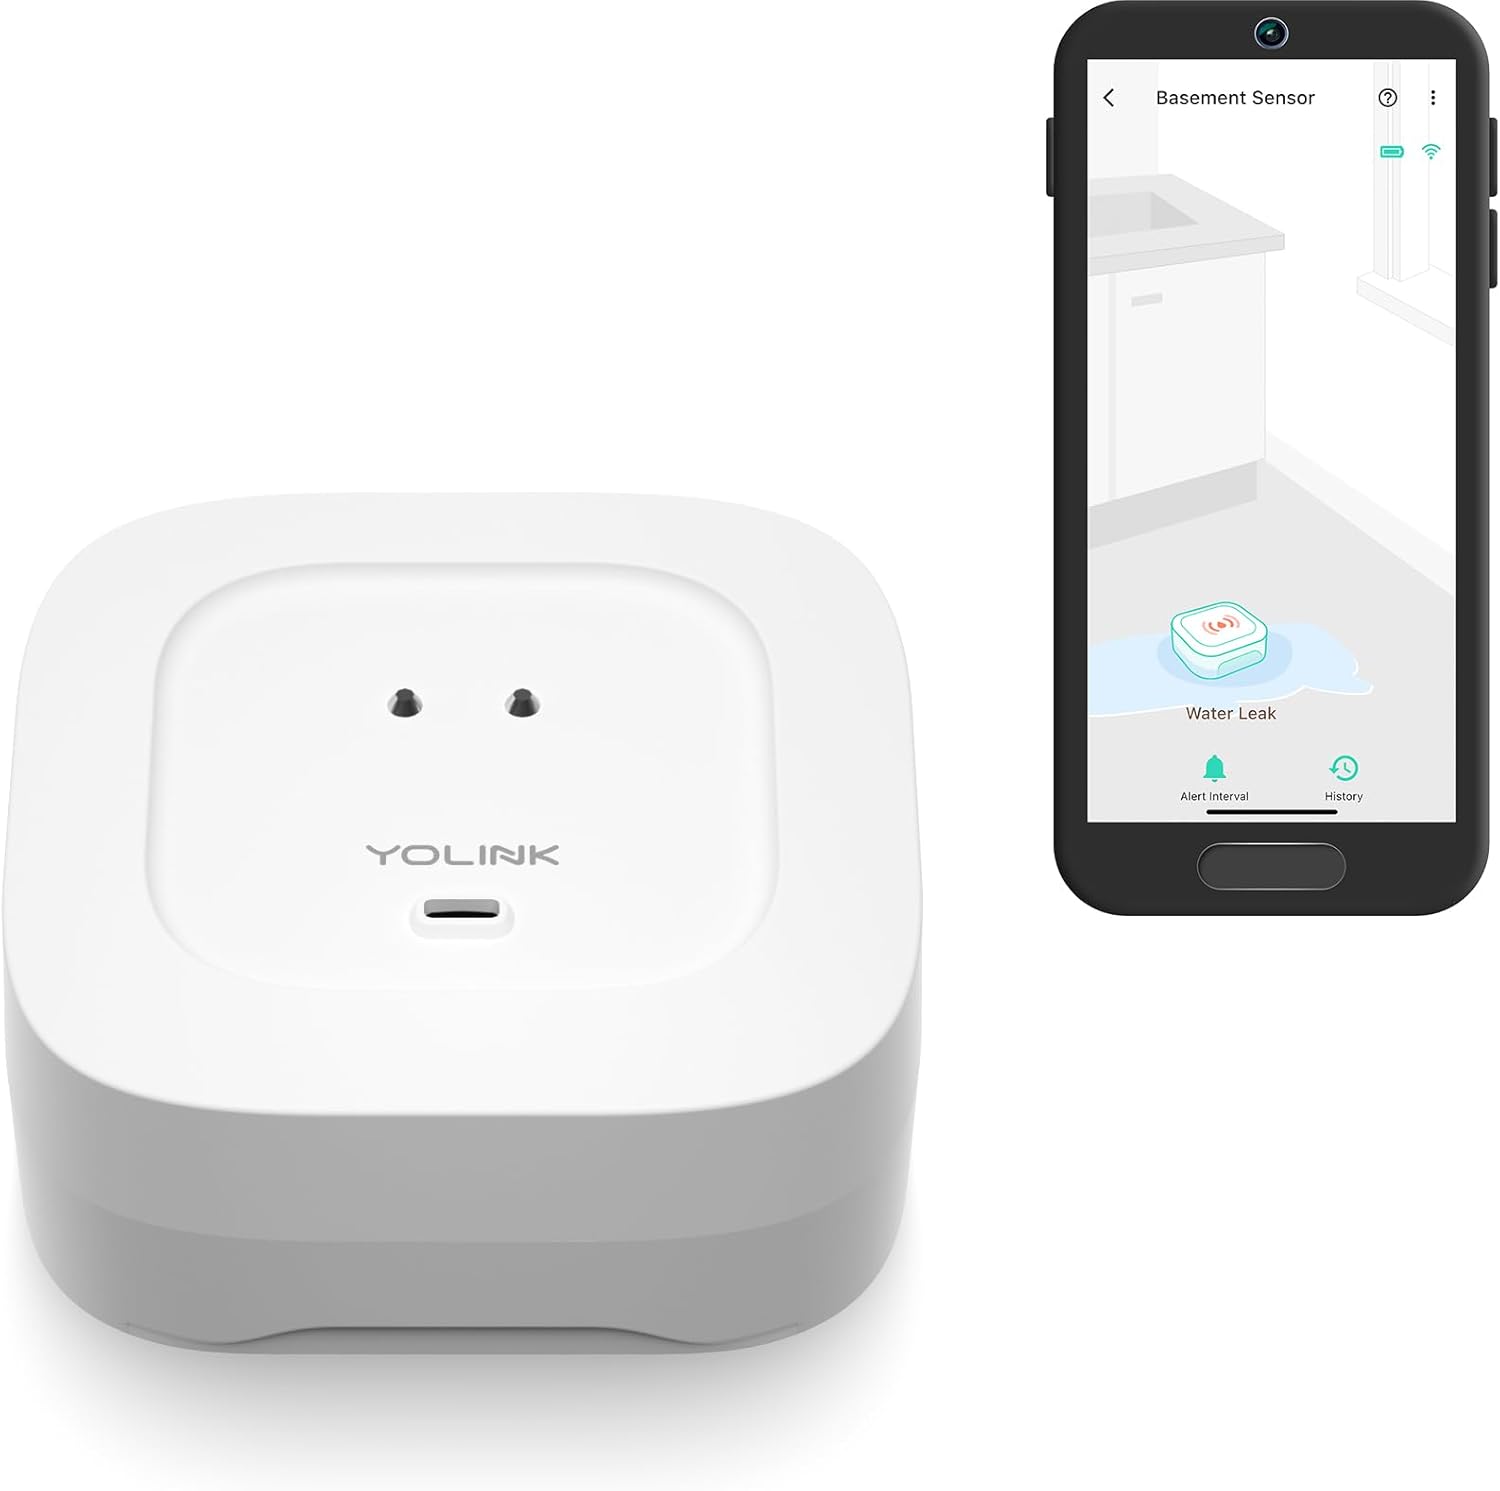
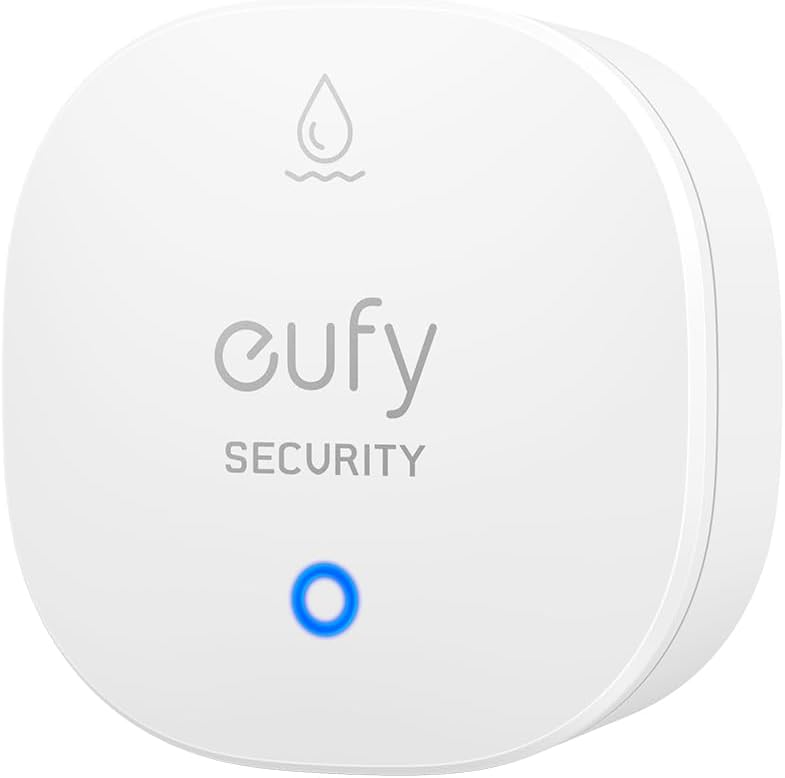
Water damage is one of the most expensive home insurance claims. Smart leak sensors like the YoLink Water Leak Sensor 4 use LoRa technology to reach basements and garages where Wi-Fi is unreliable. The eufy Security Water and Freeze Sensor adds freeze detection to prevent burst pipes. Place them near water heaters, under sinks, and by washing machines for early warning alerts.
What are the best smart kitchen appliances in 2026?
Smart kitchen adoption is growing rapidly. The Cosori Smart Air Fryer offers app-controlled cooking with hundreds of preset recipes, while the Instant Pot Pro Plus brings Wi-Fi connectivity to pressure cooking for remote monitoring and notifications.
The Bottom Line
The smart home market hit $150.6 billion in 2024 and shows no signs of slowing, with 63% of U.S. households already owning at least one connected device. Whether you are motivated by energy savings, security, or convenience, the data points to clear category leaders worth considering.
For budget-conscious buyers: Start with the Amazon Smart Thermostat for the fastest payback at 3.5 months after rebates, and pair it with an Amazon Echo for voice control. Add the eufy Video Doorbell S220 for subscription-free security. Total investment under $200 with $150+ annual savings.
For security-focused homeowners: The Ring Video Doorbell is the most widely adopted deterrent, and homes with visible cameras are 2.7x less likely to be targeted. Pair with the Yale Assure Lock 2 for Matter-compatible smart lock coverage and an Arlo Essential Wireless camera for perimeter monitoring.
For energy savers: The Ecobee Smart Thermostat Premium delivers up to $145/year in savings with room sensors. Add Philips Hue smart lighting for an additional 10-20% lighting energy reduction, and use smart plugs to eliminate $100-200/year in vampire energy.
For Apple ecosystem households: The Apple HomePod mini is your Thread Border Router and HomeKit hub. Pair with the Nanoleaf Shapes for Matter and Thread lighting and the August Wi-Fi Smart Lock for HomeKit-compatible smart locking.
For renters: The August Wi-Fi Smart Lock installs over existing deadbolts with no permanent changes. The Govee RGBIC LED strips add smart lighting without wiring. Both the YoLink Water Leak Sensor 4 and eufy Security Water and Freeze Sensor protect against water damage without landlord approval.
For whole-home automation: Start with a hub like the Samsung SmartThings Station or Home Assistant Green for cross-protocol coverage, then build out with the Ecobee Smart Thermostat Premium, Philips Hue lighting, Ring Video Doorbell, and an iRobot Roomba Combo j9+ or Roborock S8 MaxV Ultra for automated cleaning.
Sources and Methodology
Every statistic on this page is sourced. We distinguish between three types of sources:
Industry research firms — These organizations publish market sizing reports based on proprietary data collection and modeling. Different firms use different scope definitions, which is why market size estimates vary.
- Mordor Intelligence — Global smart home market sizing (2024 report)
- Fortune Business Insights — U.S. smart home market, smart lighting market (2024 reports)
- Grand View Research — Smart speaker market, robot vacuum market (2024 reports)
- MarketsandMarkets — Smart thermostat market, smart home security market (2024 reports)
- Allied Market Research — Smart lock market (2024 report)
- Statista — Smart home penetration, household statistics (2024-2025)
- Strategy Analytics — Video doorbell adoption, security device ownership (2024)
- Parks Associates — Consumer behavior, purchase motivation, adoption barriers (2024-2025)
- eMarketer — Smart speaker market share, voice assistant usage (2025)
Government and institutional sources — These provide independently verified data, particularly on energy savings.
- ENERGY STAR (U.S. EPA) — Smart thermostat energy savings, utility rebate programs
- U.S. Department of Energy — LED energy savings, building energy data
- National Renewable Energy Laboratory (NREL) — Smart home energy management systems
- Lawrence Berkeley National Lab — Standby power/vampire energy research
- U.S. Energy Information Administration — Household energy spending data
- University of North Carolina Department of Criminal Justice — Burglar deterrence study (2021)
- Consumer Technology Association — Device pricing trends, utility programs (2025)
- American Council for an Energy-Efficient Economy — Lighting control savings
Industry bodies and manufacturers
- Connectivity Standards Alliance (CSA) — Matter specification, certification data, device adoption
- Voicebot.ai — Smart speaker installed base
- NPR/Edison Research — Smart speaker usage survey ("The Smart Audio Report")
- BrightEdge — AI Overview prevalence in search
- SparkToro — ChatGPT web search trigger rates
- Salesforce — Consumer AI usage survey (2025)
- OpenAI — ChatGPT Shopping Research announcement (2025)
- Lutron — Smart dimming energy savings data
- Vivint — Smart home ownership survey (5,000 respondents, 2024)
- Manufacturer pricing (Ring, Arlo, Google) — Subscription cost data
SmartHomeExplorer editorial analysis — Our proprietary data points draw from our consensus scoring database (192 products, 12+ expert sources), compatibility engine (64 profiles, 7 ecosystems), and Bing AI Performance analytics. Methodology details are available on individual guide pages. Where we cite our own data, we label it "SHE Data" and use "(SmartHomeExplorer editorial analysis)" as the source attribution.
A Note on Data Variance
Smart home market statistics vary significantly between research firms. For example, global market size estimates for 2024 range from $146.5 billion (Statista) to $150.6 billion (Mordor Intelligence) depending on whether the firm includes services, infrastructure, and enterprise applications. We present the most widely cited figure first and note significant discrepancies where they exist. When citing these statistics, we recommend including the source name for precision.
Author: Nicholas Miles is the founder of SmartHomeExplorer and a longtime smart home enthusiast focused on helping everyday homeowners make better technology decisions. He researches, compares, and writes about products across security, climate, lighting, leak prevention, sensors, home energy, and automation, with an emphasis on real-world usefulness, ecosystem compatibility, reliability, privacy, and long-term value. Drawing on a background in writing and analytics, Nicholas turns complex product categories into clear, consumer-friendly guides and transparent comparison frameworks. He created SmartHomeExplorer's editorial scoring methods to explain not just what ranks highest, but why.
Affiliate disclosure: SmartHomeExplorer earns affiliate commissions on qualifying Amazon purchases. Our scoring methodology is independent of affiliate relationships.
If you cite data from this page, a link to SmartHomeExplorer.com/guides/smart-home-statistics-2026 is appreciated.